PowerSAGMonitor Part 1: Overview ── Building a Device with Claude to Record Outages, Momentary Interruptions, and Sags
Table of Contents
The content and implementation in this article were developed and written with Claude Code, then verified and corrected by a human. In the text, “I” refers to the human, and “Claude” refers to the AI.
This blog has a comment section. You can post with a GitHub account.
Introduction #
This article is a record of the first time I built an electronic device together with an AI (Claude) and took it all the way to everyday use. For context, I know very little about electronic circuits. I have a bit of experience assembling electronics kits and circuits drawn by other people, but I cannot design one myself. On the other hand, in 2025 I earned Japan’s Class 2 Electrician license (Denki Kōjishi, a national license required for electrical wiring work in buildings), half as a hobby, so I know a little about AC power and can do wiring work in my own home.
Because of the background below, I decided it would be fun to build a device that an AI had designed. It also motivated me that this would not be a toy you build and then forget, but a practical device I could keep using.
Background #
My home Proxmox VE server (article on setting up Proxmox VE on my home server) seems to have been rebooting by itself at random since at least around February 2026. Around April, I heard the reboot sound at night, noticed something was wrong, and started investigating the cause with Claude.
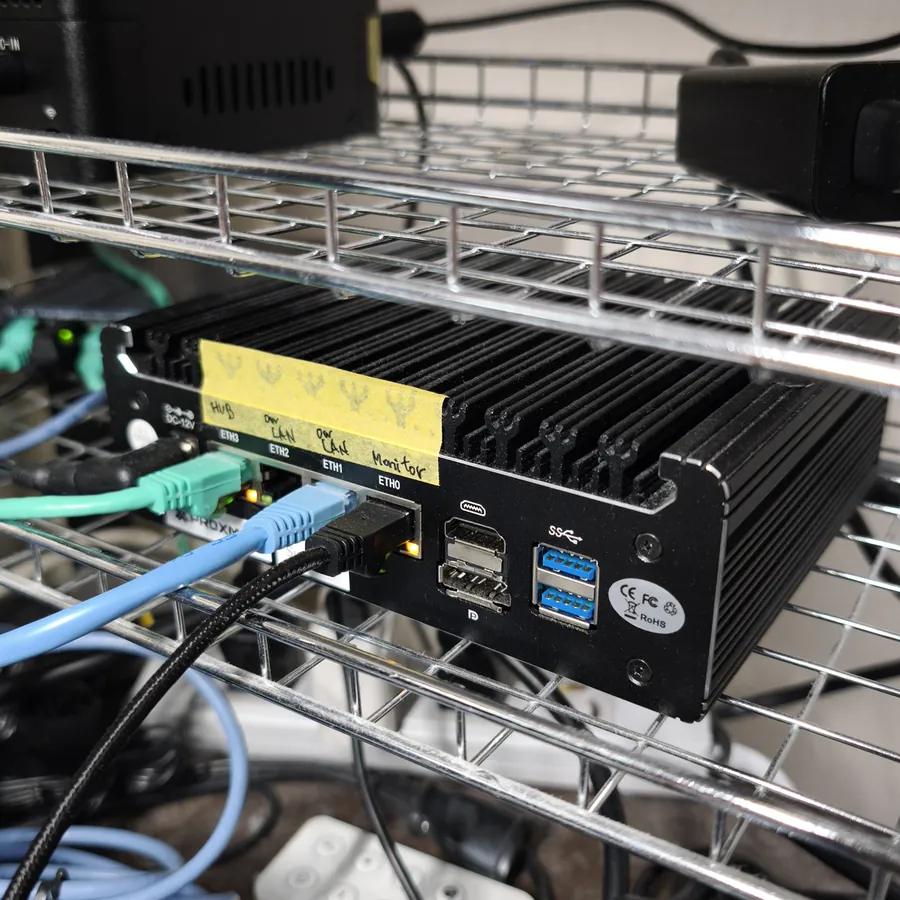
My home Proxmox VE server. Its random reboots started it all
I worked through the following suspects and countermeasures in order:
- (1) An aging AC adapter? → Replaced the AC adapter
- (2) Overheating? → Added a temperature sensor for continuous monitoring
- (3) Maybe the special driver for the temperature sensor was the problem? → Uninstalled it
- (4) The momentary interruptions I occasionally noticed? → Bought a UPS
- (5) Power management in the Linux kernel? → Limited the Intel CPU’s C-states (power-saving states) to C1E (a shallow power-saving state)
In the end, (5) was what fixed it, and the reboots stopped. By early August I had concluded that this was the main cause.
However, from July onward I had seen the lights in the house dim for an instant several times. Once I heard the short beep that my LED lights make when they power on, and realized afterwards that it might have been a momentary interruption (a very short power outage). Since I was looking into (4) at the time, Claude pointed out that a “sag” (a temporary drop in voltage) could also be a cause of the server reboots.
As a countermeasure, I first bought a UPS (uninterruptible power supply) to protect just the server. Even after that, the room lights dimmed for about a second once every few days.
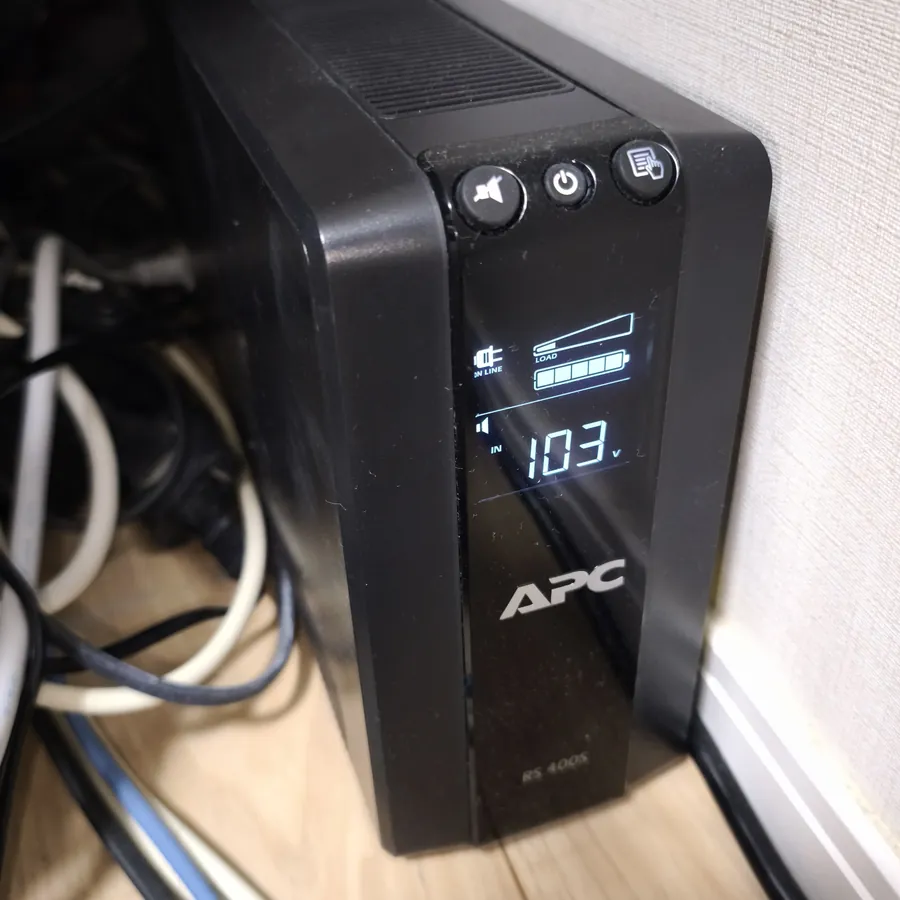
The UPS I bought. The LCD shows the input voltage
The model I bought (APC RS series), however, is not a high-end model like the Smart-UPS, so it does not produce detailed logs. A fairly long momentary interruption or an outage makes it switch to battery and leaves a log entry, but a shallow sag of under a second is corrected by AVR (automatic voltage regulation) and leaves no log at all. Even when a deep sag makes it switch to battery, the log only says that it switched. How far the voltage dropped and how long it lasted remain unknown. The input voltage that can be read from the UPS is also only updated once a minute, so an event lasting tens of milliseconds gets lost in between.
While setting up monitoring for the server, I had also built Home Assistant (open-source home automation software) to compare the room temperature with the CPU temperature. Since I already had Home Assistant, I wanted to monitor the power too. I looked into buying a power sensor, but could not find an inexpensive product that detects sags. Most commercial power sensors send an average value every few seconds to tens of seconds. A sag caused by something like a lightning strike usually ends in about 0.1 seconds, so it disappears into the average.
When I asked Claude, it suggested options such as “rent a power quality analyzer” or “build the sensor yourself.” Power quality analyzers are expensive professional instruments, though, and there is no option aimed at homes. So I decided to take on the challenge of building an electronic circuit together with Claude.
The result is PowerSAGMonitor, the device introduced in this article. It took about two months from idea to completion.
This article is Part 1 (Overview) of a three-part series. It covers what the device can tell you, how it is put together, and how it looks in Home Assistant.
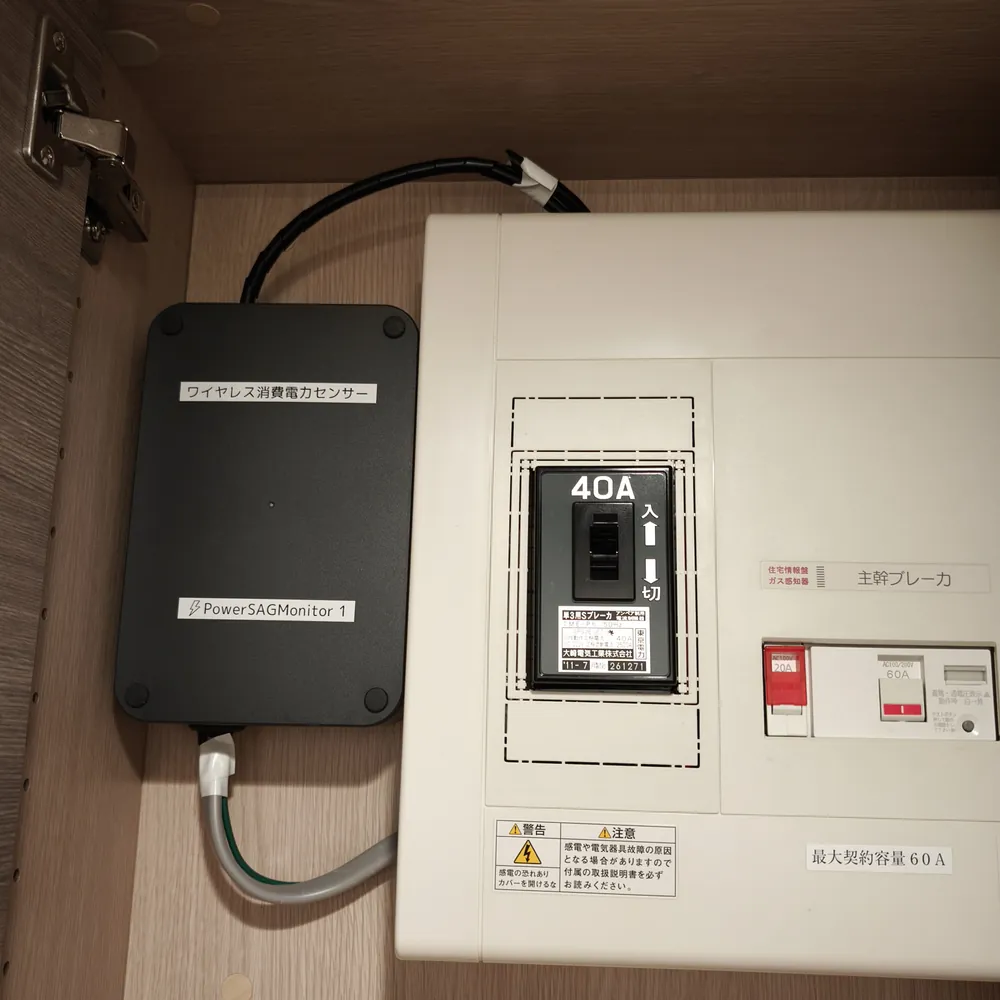
PowerSAGMonitor mounted next to the breaker panel
How Electricity Comes into a Home #
Before describing the device, let me explain how electricity is brought into a home. The names L1 and L2 in this article, and the talk of 100V and 200V, are based on this.
Electricity comes into the home from a transformer (a device that changes voltage) on a utility pole. Japanese homes use one of the following two methods.
| Method | Wires | Available voltages |
|---|---|---|
| Single-phase 2-wire | Two: L (line) and N (neutral) | 100V only |
| Single-phase 3-wire | Three: L1, N, L2 | 100V between L1–N and L2–N, 200V between L1–L2 |
In the single-phase 3-wire system, N is taken from the center of the transformer coil, and its two ends become L1 and L2. L1 and L2 are each at 100V relative to N, in opposite directions, so across L1–L2 they add up to 200V. Almost all homes today use this system, which also allows 200V appliances such as air conditioners and induction cooktops. It is the same arrangement as the 120V/240V split-phase system in North America.
| Region | Household voltage | Frequency | Supply method |
|---|---|---|---|
| Japan | 100V / 200V | 50Hz (east), 60Hz (west) | Single-phase 3-wire |
| North America (US, Canada) | 120V / 240V | 60Hz | Single-phase 3-wire |
| Europe | 230V | 50Hz | Single-phase 2-wire. Many homes also have three-phase (400V) service |
| China | 220V | 50Hz | Single-phase 2-wire, or three-phase |
Japan uses the same supply method as North America, but 100V is used almost nowhere else in the world. The split between frequencies inside Japan goes back to the Meiji era, when Tokyo installed German generators (50Hz) and Osaka installed American ones (60Hz) (Panasonic, Japanese). The boundary runs roughly from the Fuji River in Shizuoka Prefecture to Itoigawa in Niigata Prefecture (Hitachi Energy, Japanese). Voltages, frequencies, and supply methods by country are from Wikipedia.
What PowerSAGMonitor Can Tell You #
PowerSAGMonitor is a meter that is mounted next to the home’s breaker panel (the box that splits incoming electricity into the circuits for each room) and constantly watches the power for the whole house. It is designed for homes with the single-phase 3-wire service described above, and measures the voltage and current of L1 and L2 separately. Broadly, it tells you two things:
- Voltage anomalies: when an outage, momentary interruption, sag, or swell (a temporary rise in voltage) started, how long it lasted, and how far the voltage dropped (or rose)
- Everyday power use: voltage, current, power, and energy (power accumulated over time, in kWh, which is what the electricity bill is based on) for each of L1 and L2, every minute
What I call each voltage anomaly #
There are no clear definitions of outages and momentary interruptions in Japanese standards. In this article, I follow the US standard IEEE 1159 (IEEE is the Institute of Electrical and Electronics Engineers), which is widely used to classify power quality, and distinguish them as follows (explanation of IEEE terms).
| Term used in this article | What happens | How the device detects it | Duration |
|---|---|---|---|
| Outage | Power stops | Voltage below 10% of normal | 1 minute or more |
| Momentary interruption | Power stops but soon returns | Same as above | Less than 1 minute |
| Sag | Power is still there, but the voltage drops temporarily | Starts below 90% of normal, ends above 92% | Any |
| Swell | Voltage rises temporarily | Starts above 110% of normal, ends below 108% | Any |
The device itself does not distinguish outages from momentary interruptions. It records both as “power stopped” along with the duration. The 1-minute line is drawn by whoever reads the records. The start and end thresholds are slightly offset so that, when the voltage wobbles near the boundary, an event does not start and end over and over. On low-voltage distribution lines, it is common to start a sag at 90% with a 2% offset (Schneider Electric technical note), and the device uses the same values.
Japanese utilities have their own term for voltage drops caused by faults on transmission lines, such as lightning strikes. This device only looks at the voltage and cannot tell the cause, so I use the cause-neutral term “sag.”
Why it checks every 10ms #
A sag caused by a transmission line fault usually ends in about 0.1 seconds. According to a TEPCO Power Grid document (Japanese), when a fault occurs on a 500kV line, the highest-voltage transmission line, the sag lasts only about 60ms.
PowerSAGMonitor calculates the RMS value of the voltage (the size of an alternating current expressed as the equivalent direct current value; the “100V” of a household outlet is also an RMS value) for every half of an AC wave (a half-cycle; 10ms at 50Hz), and decides whether a sag is happening. A 60ms sag is caught across six checks.
Any drop that lasts longer than the check interval is caught without fail. On the other hand, if you look at a one-second average, a 60ms drop is only a small part of that second, so the average barely changes.
In fact, the UPS log did once record that it “switched to battery for 2 seconds.” These 2 seconds, however, are not the length of the voltage disturbance. They are the time the UPS waits for the input to stabilize before switching back to utility power. The log also recorded that it switched not because the voltage fell below a threshold, but because the voltage changed too quickly. The Claude I had been consulting about the server reboots estimated that the actual disturbance lasted a few cycles (tens of milliseconds). That is an estimate, not a measurement. As mentioned above, from the downstream side of a UPS you cannot tell how far, or for how long, the voltage on the primary (input) side actually dropped.
To record events lasting tens of milliseconds, you really do need to check every 10ms.
Overall Architecture #
The diagram below shows the overall setup, from PowerSAGMonitor to Home Assistant.
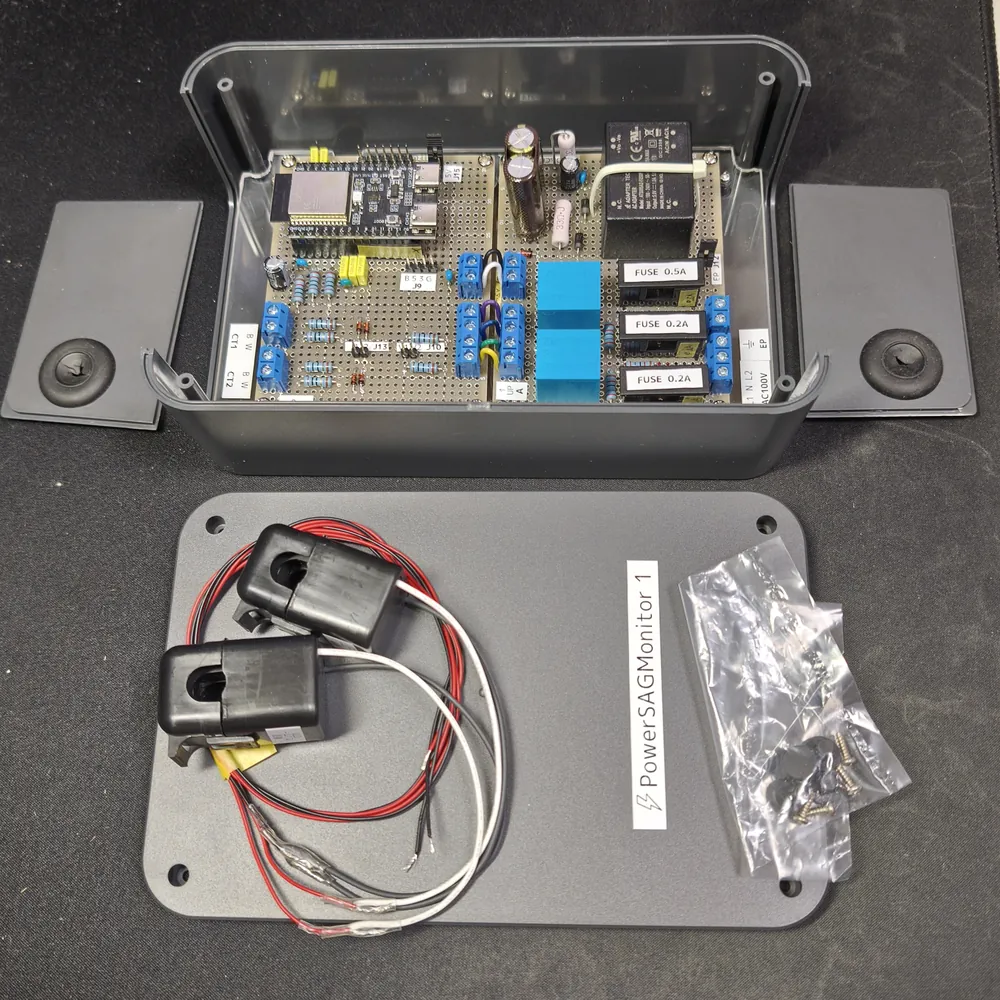
Inside the box. In front are the lid and the current sensors (CT)
PowerSAGMonitor measures the voltage and current of L1 and L2 of the single-phase 3-wire system separately.
| Component | Role |
|---|---|
| Breaker panel | What is being measured. Wiring the voltage directly from the secondary (output) side of the main breaker would be dangerous, so the voltage is taken from a branch breaker added just for PowerSAGMonitor. Current is measured with current sensors (CTs) clamped around the main breaker’s wires |
| PowerSAGMonitor | A resin case mounted next to the breaker panel (called “the box” below). A microcontroller (here, an ESP32-C6) reads the sensor signals, and measuring, detecting, recording, and sending are all done inside the box |
| Zigbee | The wireless link from the microcontroller to the home network. A low-power, mesh-type wireless standard for appliances and sensors |
| Zigbee2MQTT | Software that relays Zigbee devices to Home Assistant. It takes data received by the Zigbee hub (the coordinator) and passes it on as named values such as voltage and power. It is also used to update the device’s firmware |
| Home Assistant | Stores and graphs the values. You can also build notification automations. The energy values can be used as-is in Home Assistant’s Energy dashboard |
A CT (current transformer) is a sensor that clamps around a wire and outputs a small current proportional to the current flowing through it. It is a clamp type that opens up, so it can be attached without disconnecting existing wiring.
The 100V cable going into the box (three conductors: L1, N, L2) is used both for measuring voltage and for powering the box itself.
Why the microcontroller does the detection #
Checking every 10ms produces 100 results per second. Sending all of them over the air is not realistic. Instead, the microcontroller itself sums up “when, what, and for how long” into a single event, and sends only that result. For everyday voltage, current, power, and so on, it sends a one-minute summary (average, minimum, maximum).
Why Zigbee #
All it sends is a summary once a minute plus the occasional event, so small amounts of data are enough. Zigbee uses less power than Wi-Fi. During an outage, the box runs only on the energy stored in its capacitor, so the lower the power consumption, the longer it keeps running. The box keeps running for about a minute after an outage starts, and during that time the microcontroller records when the outage began.
How It Looks in Home Assistant #
This is how the box’s values look on the HA (Home Assistant) screens. Part 3 covers how to use them in more detail.
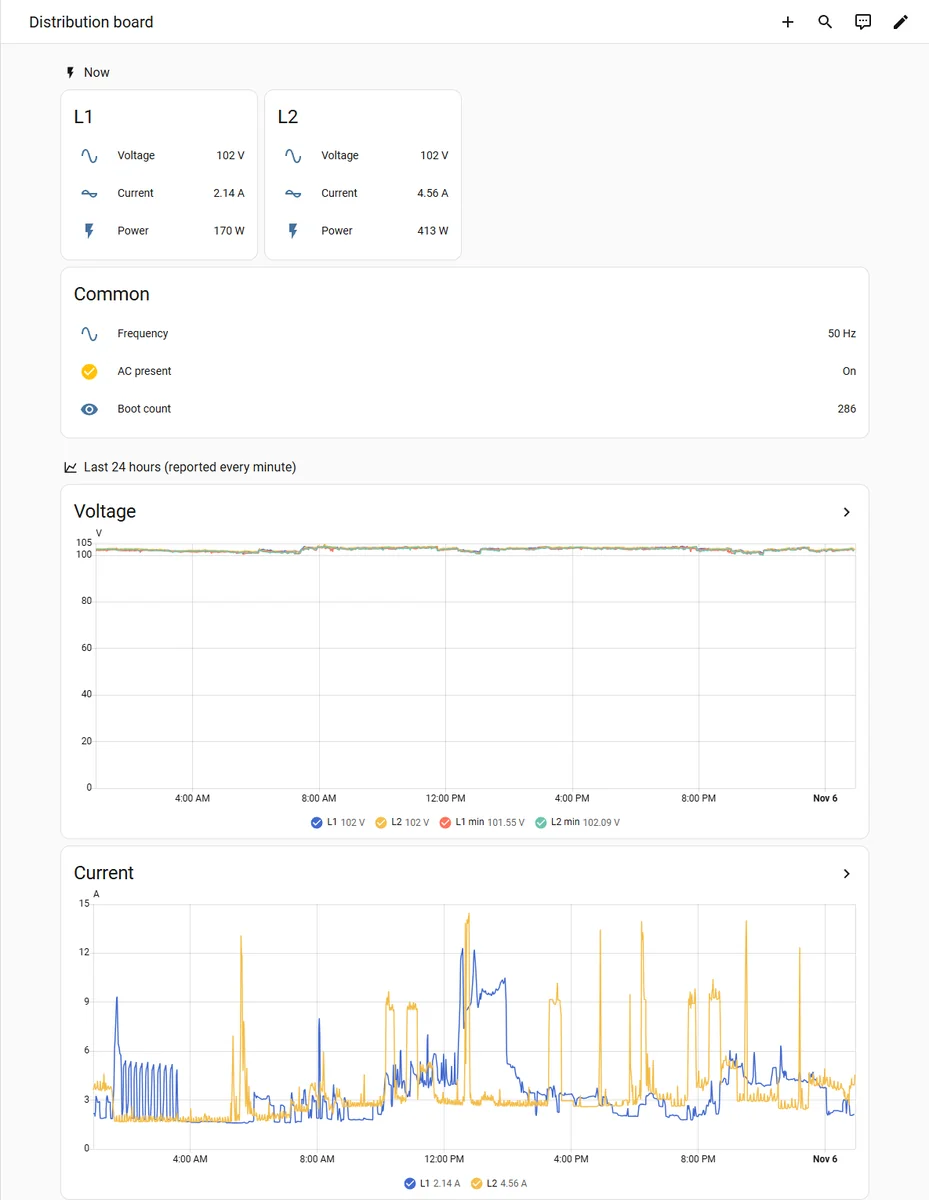
The HA dashboard. Current values, plus voltage and current over the last 24 hours
When an outage or sag occurs, the box sums it up as a single event and sends it. Below is an example from a test in which I switched off the breaker.
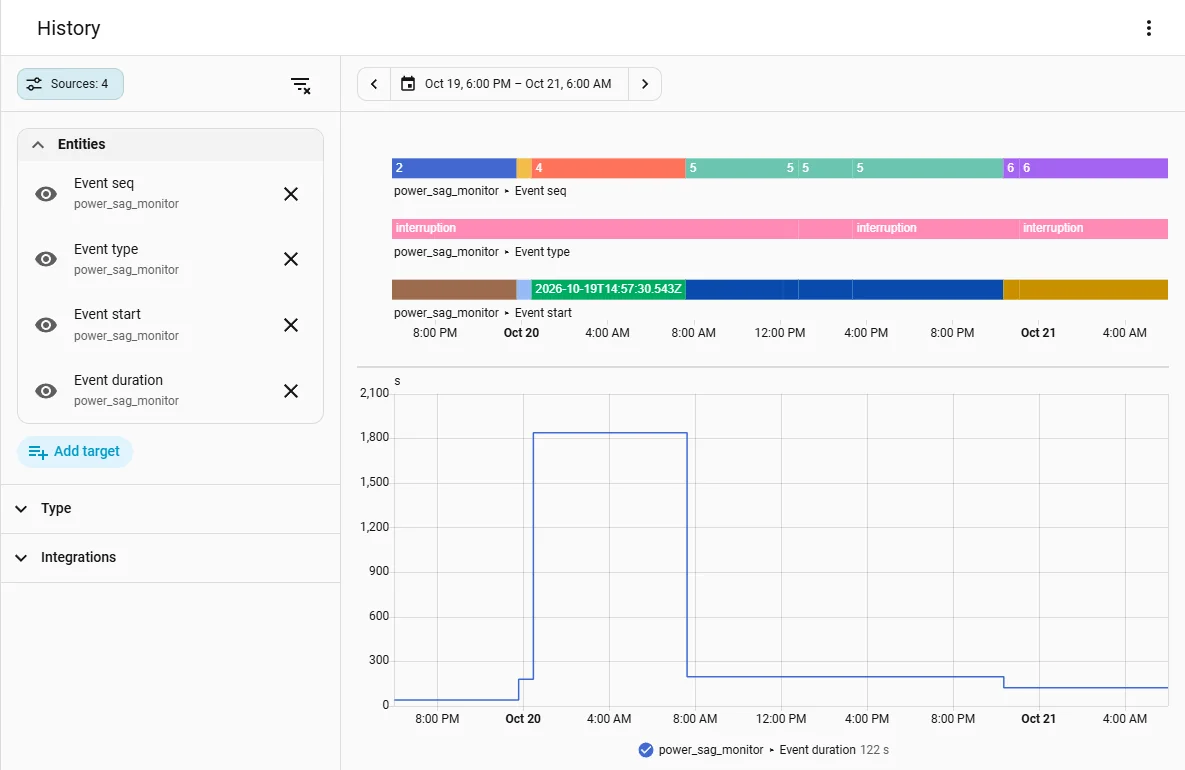
Event history (October 19–21). Each increment of the sequence number (Event seq) is one event. The type interruption means power stopped; the graph below shows how long it lasted
Key Specifications #
What it measures #
| Item | Specification |
|---|---|
| Voltage | 2 ch, L1 and L2. In practice it can measure up to 205V (so it can even capture the fault where a broken neutral puts 200V across a 100V circuit) |
| Current | 2 ch, L1 and L2. Up to 80A continuous. Accuracy is roughly ±5%, and readings are coarse below about 1A |
| Power | Calculates active power (what is usually called “power consumption”) and reactive power (power that just goes back and forth between the source and the appliance and does no work) separately for L1 and L2, and sends one-minute averages |
| Energy | Accumulated values for L1 and L2 separately (0.1Wh resolution). Matched the daily values from the utility’s smart meter within ±1% (measured October 22–31, 2026: +0.2 to −0.9%) |
| Frequency | One-minute average (0.01Hz resolution) |
| Supported regions | Built on the assumption it will be used in a 50Hz region (eastern Japan). The half-cycle boundaries are designed to follow 60Hz as well, but some values, such as corrections in the power calculation, still assume 50Hz, and it has not been tested at 60Hz |
| Check interval | Calculates the RMS voltage every half-cycle (10ms at 50Hz) |
| Detection baseline | The normal voltage is not a fixed value; it continuously tracks the average over roughly the last minute, separately for L1 and L2. The thresholds for sag, swell, and outage are as shown in the table under “What I call each voltage anomaly” above |
| Time | The box has no clock of its own; it gets the time from the Zigbee coordinator (resynchronized every hour) |
Anomalies on L1 and L2 are combined into a single event. The event starts when either one goes outside the thresholds and ends when both have returned.
Power supply and behavior during outages #
| Item | Specification |
|---|---|
| Power supply | A power module inside the box makes 5V from the AC100V line brought in for measurement |
| Energy storage for outages | 5F EDLC (electric double-layer capacitor; stores orders of magnitude more energy than an ordinary capacitor) |
| Running time during an outage | About 1 minute after the outage starts |
| Outage record | Writes the start time to flash memory. The duration is finalized and sent when the box starts up after power returns |
| Sending during an outage | One-minute summaries are not sent. The number of skipped summaries is recorded |
| After power returns | Starts up automatically, rejoins the Zigbee network, and sends any queued events, oldest first |
It does not send during an outage because the Zigbee routers in the house are also down, so anything sent would likely not arrive. Keeping the records inside the box means nothing gets lost.
Timeline and Division of Roles #
It took about two months from idea to completion.
| Date (2026) | What happened |
|---|---|
| August 26 | Idea |
| August 29 – September 22 | Design, buying parts, drawings |
| September 23 onward | Assembly (soldering, case work) |
| October 17 | Mounted at the breaker panel; started operation |
| October 25 | Firmware 1.0.0 (the first official release after tuning) |
- My (the human’s) part: coming up with ideas, deciding the direction, buying parts, and the physical work such as soldering, case work, wiring at the breaker panel, and measurement
- Claude’s (the AI’s) part: the detailed hardware and software design, including circuit design, drawings, the assembly procedures, and the firmware
The Git repository served as the single source of truth for communication between Claude and me. Design documents are in Markdown, and drawings are managed through generation scripts written by Claude.
Part 2 (Build) goes into detail on how the work was done.
Caution #
Parts of the box carry AC100V. If you build a similar device, be very careful about electric shock and fire.
Coming Up Next #
Part 2 (Build) covers everything from design to installation at the breaker panel. It will cover the KiCad drawings generated by Claude, the physical wiring layout for the perfboard, the assembly schedule with over 300 steps, and the hardware troubles that came up during the build.
References #
- Panasonic, “Single-phase 3-wire system (TERASU glossary)” (Japanese)
- Wikipedia, “Mains electricity by country”
- Panasonic, “Frequency (basics of electrical equipment)” (Japanese)
- Hitachi Energy, “Interregional HVDC grid interconnection” (Japanese)
- Consulting-Specifying Engineer, “Learning the Lingo: Standard IEEE Terminology”
- Schneider Electric, “Supply voltage dips (PM8000)”
- TEPCO Power Grid, Gunma Load Dispatching Office, “Newsletter No. 4: About momentary voltage drops” (Japanese, PDF)