PowerSAGMonitor Part 3: Operation ── Home Assistant Integration and Tuning

Table of Contents
The content and implementation in this article were developed and written with Claude Code, then verified and corrected by a human. In the text, “I” refers to the human, and “Claude” refers to the AI.
This blog has a comment section. You can post with a GitHub account.
Introduction #
This article is Part 3 of a three-part series about PowerSAGMonitor, a meter that sits at my home’s breaker panel and records power outages, momentary interruptions (very short outages), and voltage drops (sags). Part 1 (Overview) introduced the device as a whole, and Part 2 (Build) covered everything from design to installation. This part covers integration with Home Assistant (HA below; software that collects values from home devices and builds graphs and notifications), tuning of the firmware (the software running on the microcontroller), the bugs that were hard to fix, and how the device is running today.
Joining Zigbee2MQTT #
Zigbee is a low-power, short-range wireless standard used in smart home devices such as lights and sensors. Here I only cover the points needed for this article.
Zigbee devices connect to each other like a mesh to form a network. At the center is the coordinator (the Zigbee hub; in my home, a USB dongle plugged into the server), and Zigbee devices powered from an outlet act as routers that relay radio signals. The box (the whole resin case of the device) joins as an end device, picks one nearby router or the coordinator as its parent, and communicates through that parent.
Data received by the coordinator is passed to HA by Zigbee2MQTT (software that connects Zigbee devices to HA) over MQTT (a mechanism for exchanging values between devices and software).
Instead of the standard power measurement mechanism (clusters; data types defined per function in Zigbee), I created one manufacturer-specific cluster and carried four kinds of data on it as byte strings. The reasons are that a standard cluster can only represent one phase, so the L1 and L2 values end up in separate frames, and that there is no standard for event records. The byte strings are turned into named values by a Zigbee2MQTT converter script (external converter).
Reports are sent with delivery acknowledgment. Events stay in the box until an acknowledgment comes back, and are resent oldest first once a connection is available. The one-minute summaries are not resent, but since energy is a cumulative value, the next value catches up.
Using It in Home Assistant #
Values received #
| When it arrives | Main values |
|---|---|
| Every minute | Voltage of L1 and L2 (mean voltage_l1, min voltage_min_l1, max voltage_max_l1), current, active power, reactive power, energy (cumulative), frequency, whether AC is present, self-test result, time sync |
| When an event ends | Type (event_type), start time, duration, min and max voltage of L1 and L2, normal voltage just before, max current, sequence number (event_seq) |
| After booting | Record of the previous boot (how long it ran, why it stopped, etc.) |
| Every 10 minutes | Diagnostics (link quality, number of messages sent and failed, firmware update status) |
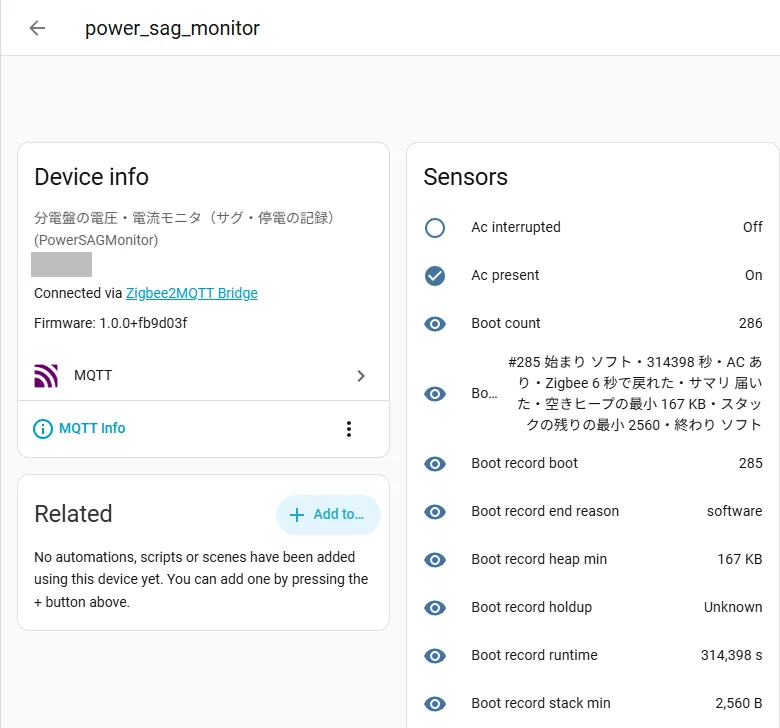
The HA device page (partial). The values sent by the box are listed. The model name and the boot record text are strings produced by the firmware and remain in Japanese
Looking at the minimum voltage #
The box takes the voltage it calculates for each half-cycle (half of a 50Hz AC wave; 10ms) and summarizes it in two stages before sending. First it computes the mean, min, and max of one second’s worth (100 values), and then it combines those over one minute (60 values). The minimum is the minimum of the per-second minimums, so the one-minute “minimum voltage” contains the value of the lowest half-cycle in that minute.
Event detection is done separately from this summarization, by comparing each half-cycle value with the thresholds one at a time. Looking at the one-minute minimum lets you see, on a graph, even shallow voltage drops that do not reach the event thresholds.
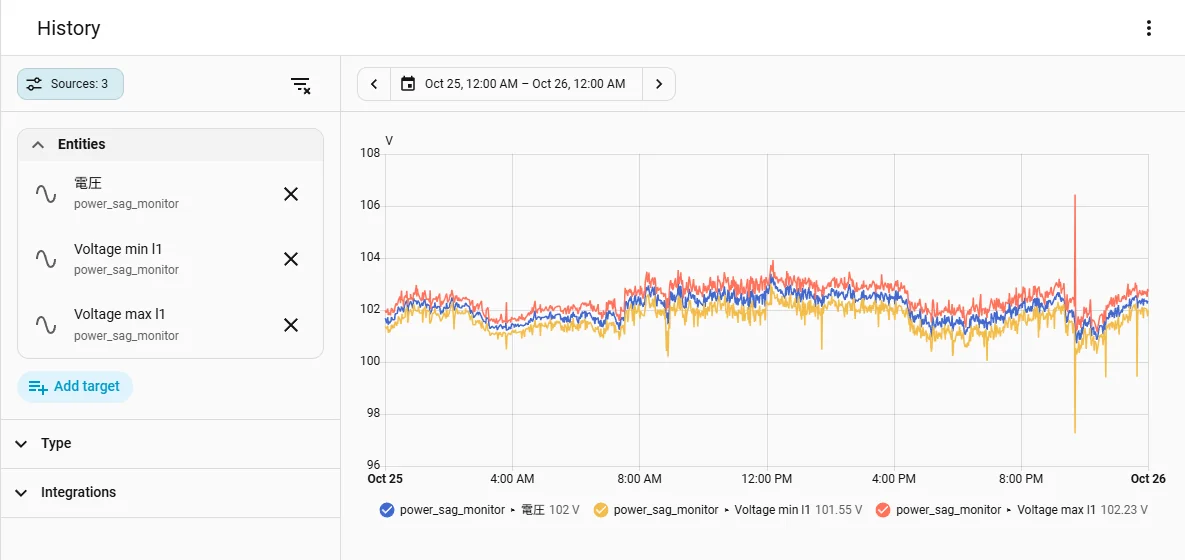
L1 voltage on October 25. Blue is the mean (labeled 電圧, the entity’s Japanese name meaning voltage), yellow is the min, and red is the max. At 21:41 the min dropped to 97.25V
The drop at 21:41 on this day was about 95% of the usual roughly 102V, which does not reach the event threshold (90%). It is a movement you would never notice by looking only at one-minute averages.
Energy dashboard #
Energy is a cumulative value that never decreases, so L1 and L2 can be registered as-is in HA’s “Energy” dashboard.
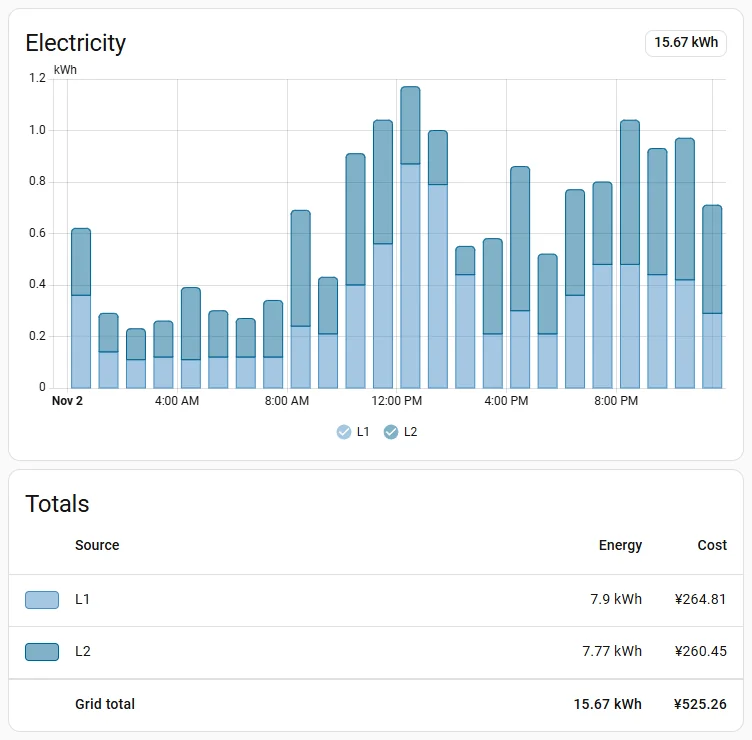
The HA Energy dashboard (November 2). L1 and L2 are registered as separate energy sources
Outage notifications #
Outage events reach HA with the timing and data shown in the diagram. Nothing is sent during the outage; after power returns and the box rejoins, it sends everything as a single event.
In HA, I am considering sending a notification whenever the event sequence number (event_seq) changes, but it is not built yet. For now, events are only recorded and shown on screen; no notification goes out.
Firmware Structure #
The firmware is built with ESP-IDF (the official development framework for the ESP32). It handles the following five jobs.
- Measure: Reads five channels (2 voltage, 2 current, 1 midpoint), each 5,000 times per second
- Compute: Splits the signal at the points where the voltage crosses 0V and calculates the RMS voltage and current for each half-cycle. Multiplies instantaneous values to get active power, reactive power, and energy
- Classify: Compares each half-cycle’s voltage with the normal baseline, decides the start and end of sags, swells (voltage rises), and outages, and combines each into a single event
- Record: Stores events (the latest 32), energy, and per-boot records in a dedicated partition of flash memory
- Send: Sends summaries, events, boot records, and diagnostics over Zigbee
Every time the box boots, it checks on its own that the calculation and detection logic works correctly. Instead of sensor values, it feeds a synthetic 50Hz waveform generated inside the firmware (with a known amplitude) through the processing, and checks that the resulting voltage is as expected (within ±0.5%).
The result is included in the one-minute summary sent to HA, and if it fails, the microcontroller’s LED turns red. This result is also used as a pass condition for OTA (Over-The-Air; wireless firmware updates), described next.
The synthetic waveform is 50Hz because the box was built on the assumption that it would be used in a 50Hz region (eastern Japan). The half-cycle boundaries are set at the points where the voltage crosses 0V, so the design does follow 60Hz, but some values, such as corrections in the power calculation, still assume 50Hz, and it has not been tested at 60Hz.
The firmware can be rewritten over Zigbee without opening the box (OTA). There are two places to write firmware; the new firmware is written to the one not in use and boots “on probation.” It passes once it passes the self-test and one summary has been delivered; if it does not pass within 10 minutes, the box reverts to the previous firmware.
Confirming that detection works #
I confirmed that the sag detection works on October 4, on my desk, before installing the box at the breaker panel. I plugged a hair dryer (1200W) into the same power strip as the board and turned it on high for about 10 seconds, twice.
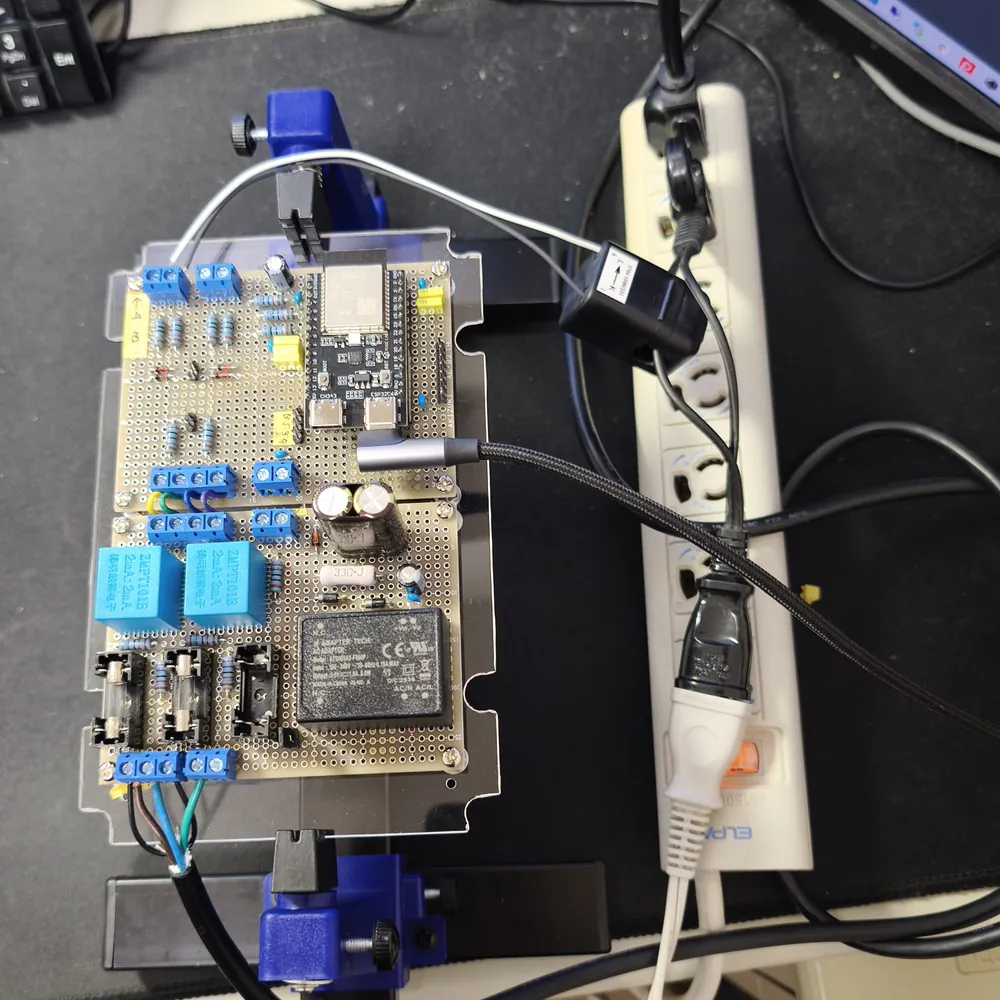
Measurement on my desk on October 4
When the dryer is on, about 11.3A flows and the voltage drops from about 102V to about 97.4V. However, that is about 95%, which does not reach the production threshold (90% of normal), so no event is recorded.
So I measured with a test build of the firmware with the threshold set to 97%, and two sags (10.68 seconds and 11.35 seconds) were recorded. The 97% value was used only for this test; production uses 90%.
Tuning #
OTA from 47 minutes to 3 #
The box is used with its lid closed next to the breaker panel, so I wanted to update the firmware wirelessly. However, the first working Zigbee OTA took about 47 minutes per update.
The firmware will keep being improved. Waiting 47 minutes every time through the cycle of updating, testing, and fixing again is far too long. Considering the rework when an update fails, I wanted it as short as possible. Through trial and error, it was cut down to about 3 minutes. Here is how it went.
| Stage | What was done | Result |
|---|---|---|
| 1 | Built a mechanism to update over Wi-Fi | Did not work (see below). Switched to Zigbee’s standard OTA |
| 2 | Zigbee OTA (no compression, 50 bytes per block) | About 47 minutes for 584KB (207 bytes/s) |
| 3 | Compressed the image with zstd and decompressed while receiving | Shrank to about 56%, about 28 minutes |
| 4 | Shortened the server’s wait time and the polling interval during the transfer | Hardly changed. After adding diagnostic values and measuring, the round trip per block was a constant 241ms |
| 5 | 64 bytes per block | About 23 minutes. This is the ceiling for the one-block-at-a-time method |
| 6 | Implemented “page requests” (one request makes the sender send a larger chunk continuously) ourselves | Read Zigbee2MQTT’s source code to match its quirks, and tested against a counterpart built on a PC |
| 7 | Tried in production, and not a single block arrived | With more detailed logging, it turned out the coordinator (the Zigbee hub) was rejecting 64-byte blocks as “too long.” The size that fits depends on the relay route |
| 8 | Went back to 50 bytes | 184 seconds (about 3 minutes) |
There are two lessons. Before trying ways to speed something up, first add a way to measure where the time is going. And a failure that shows nothing in the logs cannot be understood until you make the logs more detailed.
A boot loop at the end of an outage, and extending to 58 seconds #
To record the start of an outage in flash memory, the box is designed to keep running for about a minute after an outage on the energy stored in the EDLC (electric double-layer capacitor). Unlike a battery, an EDLC’s voltage gradually drops as its energy is used. When the voltage falls below the minimum at which the microcontroller can run, the microcontroller resets.
After an outage test, the boot sequence number had advanced not by 1 but by 5 to 7. In the production setup without USB connected, the logs are not visible, so Claude added a mechanism that saves a record of each boot (reason for starting, run time, reason for ending) in flash and sends it over Zigbee after power returns. Looking at those records after power came back, the first brownout happened about 39 seconds after the outage started, and then “boot → brownout after 5 seconds” repeated 5 to 6 times. The microcontroller was booting and stopping at a voltage right at the edge of its lower limit.
Claude took two measures. First, when waking from a brownout reset, the box checks whether AC is present before touching the radio or flash, and if not, it sleeps in 5-second intervals and waits. This eliminated the boot loop, and the sequence number now advances by only one after power returns. At this point, the run time during an outage was about 42 seconds.
Second, during an outage, the box stops sending the per-minute summaries and thins out polling of its parent to every 30 seconds, reducing power consumption. This extended the run time during an outage to about 58 seconds.
Unable to rejoin Zigbee next to the breaker panel #
Every time the box boots, it joins the Zigbee network again (rejoin). At that point, it listens to the radio of nearby routers and the coordinator and automatically chooses one as its parent. However, while it could rejoin on my desk, it could not rejoin when booted next to the breaker panel.
The cause was the lower limit on LQI (the quality of the received radio signal, expressed as 0–255; roughly an indication of signal strength, higher is better). ESP’s Zigbee library excludes any device whose LQI does not reach the default lower limit (32) from the parent candidates. Next to the breaker panel, the radio of devices that could become a parent was audible, but the LQI was low at 9–10, so all of them were excluded from the candidates.
Claude set the limit to 0, so that even devices with weak signals could be chosen as the parent. Once connected, communication works even at this weak level. Out of 59 power-cycled boots, the box rejoined 59 times, in about 5.8 seconds.
Hard Problems #
Wi-Fi did not work because of crystal drift #
Zigbee is a standard for sensors, and its communication speed is much slower than Wi-Fi. So at first I intended to do firmware updates (OTA) over Wi-Fi and built a mechanism for that (stage 1 in the table under “OTA from 47 minutes to 3”).
However, when I tried it, the box could not see a single Wi-Fi access point. It could not even see tethering from a smartphone placed right next to it. The same happened with nanoESP32-C6’s official samples: it could neither transmit nor receive. Meanwhile, Zigbee, which uses the same radio circuit and the same antenna, worked.
Claude had the microcontroller output its clock every second and compared it for 325 seconds against the clock of a Raspberry Pi synchronized with NTP (a protocol for synchronizing time). It turned out the microcontroller’s crystal (the part that serves as the timing reference) was off by −202ppm (about −490kHz at 2.44GHz). Wi-Fi can only receive within roughly ±20ppm. Zigbee’s modulation is tolerant of such drift, so it got through.
On paper, the nanoESP32-C6 supports Wi-Fi 6. A crystal drift this large may have been an initial defect in the particular unit I bought. This time I gave up on Wi-Fi and decided to do everything, both sending data and updates, over Zigbee. That is why I worked on shortening OTA while staying on Zigbee.
Overwriting 54 bytes of memory every minute #
While testing compressed OTA (stage 3 in the table under “OTA from 47 minutes to 3”), the microcontroller crashed (detected an error and reset) when the update reached 98%. It should have received everything and booted into the new firmware. I suspected the newly added decompression code, but the crash happened in a memory check routine, and memory had been corrupted before that.
The cause was in how ESP’s Zigbee library was being used. The library allocates memory for string values of only “the length at registration + 1” bytes. The value for the per-minute summary (54 bytes) had been registered with length 0, so 54 bytes were being written every minute into a 1-byte memory area. The overflow was corrupting the neighboring heap metadata. This had been going on since the day the box was installed at the breaker panel.
Claude fixed it by registering with 64 bytes and then setting the length back to 0. Claude created a reproduction that runs OTA on the real hardware, and confirmed that before the fix the memory got corrupted in about 60 seconds, while after the fix it ran to the end. Where something crashes is not necessarily the cause. The large new process (decompression) had merely exposed a small corruption that had been there all along.
The midpoint voltage was 0.3V too high #
As described in Part 2, the AC signals are passed to the ADC swinging around a 1.65V midpoint. The midpoint is made by halving 3.3V with two resistors, and that voltage is also read on a microcontroller pin (GPIO6). However, once the board was assembled and the microcontroller plugged in, the midpoint that should have been 1.65V was 1.92V. If the midpoint shifts, the signal leans to one side of the 0–3.3V range, narrowing the measurable range.
I thought the pin’s pull-up (a resistor that weakly pulls an input toward the supply) was pushing up the midpoint, but the command to disable the pull-up did not fix it. When Claude reverted the pin configuration registers one by one to check, it turned out this pull-up was not the normal pull-up setting, but was attached to the pin’s JTAG function. It goes away when the pin is switched to normal GPIO.
However, for about 0.1 seconds right after a reset, before the firmware starts running, it cannot be removed. So the midpoint value is also measured continuously and subtracted in the calculation.
JTAG is a debugging standard for inspecting and rewriting the inside of a microcontroller from outside. It uses four dedicated signal lines.
On the ESP32-C6, the four pins GPIO4–7 double as the JTAG signal lines, and right after power-on they are in JTAG mode. Of these, GPIO6 (JTAG’s MTCK) is internally pulled up while in JTAG mode. This pull-up is not removed until the pin is switched to normal input/output (GPIO) mode (according to the pin list in the ESP32-C6 datasheet). As it happened, GPIO6 was the pin assigned to read the midpoint.
Measurement stalled because USB was clogged #
This is not about production operation, but about development. While developing the firmware, I connected the microcontroller to a PC or a Raspberry Pi over USB and, while measuring, sent logs such as per-second values over USB to watch on screen. Measurement was supposed to keep going even while the program reading the logs was closed.
However, while the PC was not reading the logs, the elapsed seconds (counted from the number of measurements read) advanced only 13 seconds in 40.
USB was not too slow. With USB, the microcontroller can only send data when the PC side comes and asks for it. When you close the log-reading program on the PC, the PC stops asking for data. Then the microcontroller’s USB transmit buffer (a small piece of memory holding data to send) stays full, and the code writing logs has to wait for space. In the firmware at the time, measurement and log output ran in sequence within the same loop, so every log write made it wait, and measurement stopped too. Measurements during those stalls were discarded.
Claude separated log output from measurement into its own task (the log task). The measurement loop only puts logs into a buffer (4KB) and never waits. Sending to USB is done by the log task, which has lower priority than measurement. If the buffer overflows, that line is dropped. After the fix, even with logs not read for 45 seconds, the elapsed seconds advanced 46 seconds.
Working with Claude #
During firmware development and debugging, I ran Claude Code 24 hours a day on the Raspberry Pi connected to the box. Coordination with Claude on the Windows PC, my main development machine, was done through a HANDOFF.md (handover notes) file in the Git repository, which was rewritten and pushed at each break in the work. During the tuning period before completion, Claude kept running the cycle “fix the firmware → test on the PC → OTA → confirm after 10 minutes that it has not reverted” even while I was out. When I got home, I checked the box’s status via Claude on the Windows PC → Raspberry Pi.
Claude only touched the production Home Assistant and Zigbee2MQTT within the scope I had approved (joining, the converter script, OTA), and always took a backup first.
Claude makes mistakes too. Besides the misdiagnosis of the power module and the mirrored outline drawing introduced in Part 2, a bug in a script that rewrote a production configuration file once left the OTA index empty for about a minute. That time, Claude noticed on its own and recovered.
There were also things Claude could not have found on its own. The “moving short” and the straight USB-C cable that would not plug in, both covered in Part 2, were noticed by me, standing in front of the real thing. The detailed design could be left almost entirely to Claude, but the role of looking at and touching the real hardware still needs a human.
Current Status #
Here is a record of the situation as of November 1, 2026.
Still watching for sags #
From the start of operation on October 17 to November 1, six events were recorded, all of them from me switching off the breaker for tests or work. Not a single outage, momentary interruption, sag, or swell other than the tests has been recorded yet. Strictly speaking, no detection happens while the box is rebooting (during OTA and so on), so I cannot go as far as saying “none has ever occurred.” That the detection itself works was confirmed with the hair dryer test described earlier.
The thresholds were never reached, but the one-minute min and max do show some movement. Since the night of October 20, the lowest was 97.25V on L1 (about 95% of the usual roughly 102V), and the highest was 108.94V on L1 (about 106%). The cause has not been identified.
Even when the receiving side stops #
I restarted Home Assistant (the receiving side) itself for updates, and rebooted the physical server for updates, several times. The box itself, however, ran for about 7 days and 8 hours, from booting on October 25 to November 1, without rebooting once and without rejoining Zigbee.
Since October 27, per-minute reports went missing 4 times, 23 messages in total, all overlapping with times when the receiving side was down. In two of those cases, the Zigbee dongle did not respond after a server reboot, and I unplugged and replugged it to recover. That is a problem on the receiving side, unrelated to the box.
Since October 20, a total of 17,658 summaries received delivery acknowledgments, and 14 did not. Those 14 were from the two times the dongle was down.
Energy measurement is going well #
Energy is being measured well. To check that the data makes sense, I compared it with the values from the utility’s smart meter. On “Kurashi TEPCO web,” the member website of TEPCO Energy Partner (my electricity retailer), you can see the daily usage (in 0.1kWh steps) measured by the smart meter.
A smart meter is an electricity meter (energy meter) that measures household electricity use digitally and has communication capabilities. In the area where I live, they are installed by TEPCO Power Grid, the company responsible for transmission and distribution. Conventional meters gave a month’s usage from a monthly reading, while smart meters measure usage every 30 minutes. Under Japanese law, electricity meters must be checked for accuracy by a government-designated body, and they are replaced before their validity period (5–10 years) expires.
The measured values are sent over a communication network to the utility’s meter data management system (MDMS). In densely populated areas, neighboring smart meters relay values to each other like a bucket brigade until they reach a concentrator mounted on a utility pole or similar (the wireless multi-hop method). In suburban and mountainous areas, they send directly to cellular base stations (the cellular method). Communication over the power lines (PLC) is also said to be used in combination. This route to the utility is called the “A-route.” According to a document from Japan’s Ministry of Economy, Trade and Industry (Agency for Natural Resources and Energy), under the current smart meter specifications, the 30-minute usage (active energy) is collected every 30 minutes and passed to retail electricity companies and others within 60 minutes.
There is also a route (the “B-route”) that passes values to devices inside the home (a HEMS, a home energy management system). If you apply for it, you can receive inside the home not only the 30-minute usage but also values such as the present current.
For the next generation of smart meters, the specifications call for collecting 5-minute values such as voltage, in addition to usage, from some homes (at least about 10%) (from the 2022 study group’s report). The collected values are also said to be used to detect outages and their restoration.
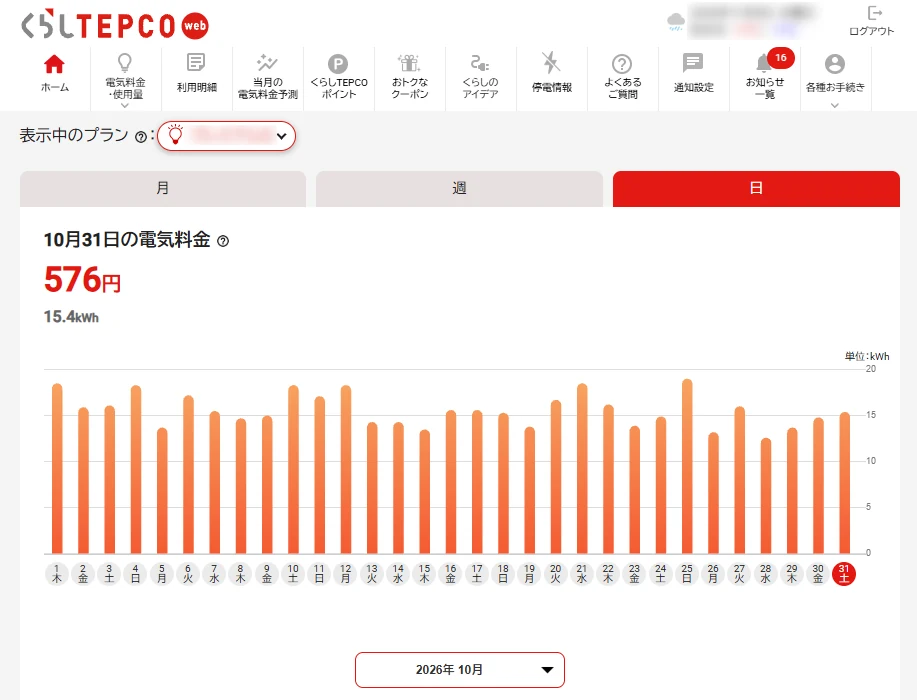
Daily usage for October on Kurashi TEPCO web (the site is in Japanese). The tabs are Month / Week / Day, with Day selected. At the top: the electricity charge for October 31 (576 yen) and the usage (15.4kWh). The bars are the daily usage in kWh; the labels below them are the date and day of the week
I compared, day by day, the utility’s smart meter values with the sum of the box’s L1 and L2 energy (daily values calculated from HA’s records). Both measure the energy that passed through the main breaker of the breaker panel, so they should be almost the same.
For the 11 days from October 21 to 31, the total was 167.18kWh for the box versus 168.2kWh for the smart meter, a difference of −0.61%. From October 22 onward, after the firmware updates settled down, the daily difference was +0.2 to −0.9%, within ±1%. I have not investigated why the box reads slightly lower almost every day. Even on the day reports went missing (October 29), the difference did not widen, showing that the design of catching up with cumulative values works. However, on days with many reboots due to firmware updates, the difference was large (−11.5% on October 18); naturally, nothing can be measured while the box is stopped.
Summary #
Prompted by my home server’s random reboots, I spent about two months building a device with Claude to record sags. As mentioned in the background in Part 1, the server’s random reboots were probably solved from a different direction, but I am genuinely happy that, as a by-product, I got the experience of building electronics and a practical device.
Unfortunately, the sags that were the main purpose of this device have not been detected even once since it was completed in late October. Around July and August, they were frequent enough that I noticed one every few days; there may have been a reason, such as tight power supply in the neighborhood during the extreme heat. It is ironic that after I built a device to detect the problem, the problem went away.
While working out the concept for this device, it meant a lot that building on the standards of Home Assistant and Zigbee let me picture the goal of “making it visible.” At the very least, it has started to prove useful for analyzing my home’s power consumption. An original sensor → an original communication protocol → an original UI could probably also be built with the help of AI, but it would be a one-off with no room for further use. Before long it would become obsolete and fall out of use.
I managed to finish it despite my limited knowledge of electricity, but now I am thinking of stepping back and learning the basics of electronic circuits. Once I understand things a little better, I hope to build something else.
References #
- Espressif Systems, “ESP32-C6 Series Datasheet” (PDF)
- TEPCO Power Grid, “What is an electricity meter?” (Japanese)
- TEPCO Power Grid, “What are the ‘smart meters’ being rolled out with new features such as communication?” (TEPCO newsletter, April 1, 2016, Japanese)
- Agency for Natural Resources and Energy, “Standard functions of next-generation smart meters (interim report)” (February 18, 2021, Japanese, PDF)
- Next-Generation Smart Meter System Study Group, “Report of the Next-Generation Smart Meter System Study Group” (May 2022, Japanese, PDF)